A World Where Everyone Thrives
Fiscal Expansion to Achieve the SDGs
Shambhu Ghatak*
The Sustainable Development Goals (SDGs), which were adopted by the United Nations (UN) General Assembly in New York during its 70th Session, held on September 25, 2015, are a comprehensive list of global goals integrating social, economic and environmental dimensions of development. The 17 SDGs and associated 169 targets came into force with effect from January 1, 2016 after
the document ‘Transforming our World: The 2030 Agenda for Sustainable Development’ was unanimously adopted by the 193 UN Member States in September 2015.
The SDGs build on the Millennium Development Goals (MDGs) and their eight anti-poverty targets which the world committed to achieving by 2015. The MDGs, adopted in 2000, aimed at addressing several issues, including slashing poverty, hunger, disease, gender inequality, and access to water and sanitation. Although enormous progress was made by mankind towards attaining the MDGs, poverty could not end for all.
The idea of SDGs was conceived at the United Nations Conference on Sustainable Development, Rio+20, in 2012. The objective behind the SDGs was to produce a set of universally applicable goals that balances the three dimensions of sustainable development: environmental, social, and economic.
The first two SDGs, which are meant to guide global development efforts between 2016 and 2030 are as follows:
Goal 1: End poverty in all its forms everywhere
Goal 2: End hunger, achieve food security and improved nutrition and promote sustainable agriculture
In this article, I will discuss how difficult it would be for India to achieve the first goal of the 17 SDGs, against the backdrop of Covid-19 crisis. As we all know, the outbreak of the Covid-19 pandemic in the early months of this year has snowballed into a major global economic and health crisis across the globe. As of December 20, 2020 there have been over 75.0 million cases and about 1.7 million deaths reported globally, according to the World Health Organisation estimates. In the same time frame, India has reported over 10 million cases and nearly 1.5 lakh deaths.
Experts argue that the developing as well as the underdeveloped countries may not be able to achieve the targets that were once set under the SDGs due to the slowing down of economic growth. In the Foreword to the World Economic Outlook that was released in October 2020, Ms. Gita Gopinath, Chief Economist and Director of the Research Department, International Monetary Fund (IMF), has said that due to the recession this year, the incidence of extreme poverty would rise for the first time in over two decades. The economic crisis, a direct fallout of the pandemic would precipitate further rise in inequality across populations. This disconcerting scenario will be the aftermath of the pandemic-induced economic distress disproportionately impacting women, besides those employed in the informal sector as well as individuals with relatively lower educational qualifications and skill sets.
The IMF’s World Economic Outlook released in October 2020 also predicts that the economic progress made by the countries since the last three decades to reduce poverty would be reversed by the pandemic. Economic disparity would also rise in the postCOVID world. The daily wage workers and informal workers, a majority of whom are without formal safety nets, witnessed income losses when mobility restrictions were imposed during the lockdowns. The migrant workers from far away villages (i.e. places of origin) could not access traditional support networks in the cities when the lockdowns were imposed in
countries like India. Nearly 90 million people could fall below the $1.90 a day income threshold of extreme deprivation this year, anticipates IMF. Human capital accumulation would be severely affected as well, owing to pandemic-related school closures.
The economic progress made by the countries since the last three decades to reduce poverty would be reversed by the pandemic.
Role of MoSPI
Adoption of 2030 Agenda for Sustainable Development necessitates that countries produce quality, reliable and disaggregated data to measure their progress on the SDG targets. This data also secures that ‘No One is Left Behind.’ To integrate SDGs into our ongoing national and sub-national policies and programmes, the NITI Aayog has mapped the SDGs with centrally sponsored programmes of concerned
Central Ministries/ Departments at the national level. In addition, the Ministry of Statistics and Programme Implementation (MoSPI) developed a National Indicator Framework (NIF). This originally comprises 306 national indictors, along with identified data sources and periodicity, following due consultation process with the concerned Ministries/ Departments, UN Agencies and other stakeholders.
At present, data flow from Official Statistical System and various data source Ministries/ Departments are involved in the process of providing data on SDGs at the national level. The MoSPI coordinates with these line Ministries for institutionalising the data flow for SDG indicators. The NIF is the backbone of SDG monitoring at the national level and provides appropriate direction to policy makers and the implementing agencies on various schemes and programmes. The states/ UTs are also involved in similar exercises at their levels, their objective being the localisation of SDGs.
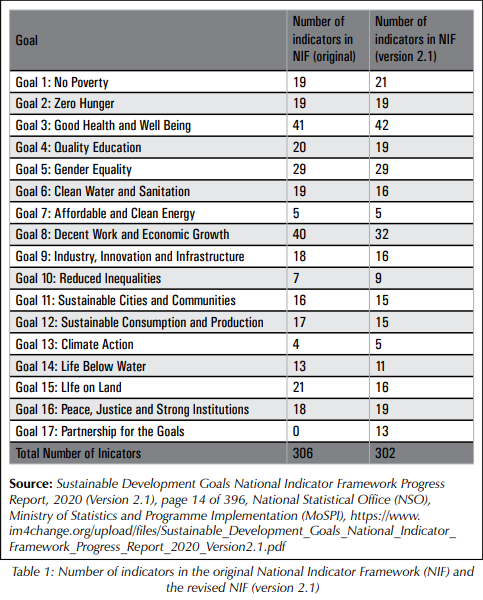
The goal-wise distribution of NIF (original as well as version 2.1, which is the latest revised version) is shown in the following In the executive summary of the ‘Sustainable Development Goals - National Indicator Framework Progress Report, 2020 (version 2.1),’ it has been mentioned that poverty is a multi-dimensional phenomenon. Poverty eradication in all its forms remains one of the greatest challenges before mankind. Extreme deprivation is not just about lack of wellbeing and opportunity, it is a question of survival too.
Targets under SDG 1
In all, SDG 1 has seven targets for measuring the progress made by India in ending multidimensional poverty. These targets are as follows:
Target 1.1: By 2030, eradicate extreme poverty for all people everywhere, currently measured as people living on less than USD1.25 a day
Target 1.2: By 2030, reduce at least by half the proportion of men, women and children of all ages living in poverty in all its dimensions according to national definitions
Target 1.3: Implement nationally appropriate social protection systems and measures for all, including floors, and by 2030 achieve substantial coverage of the poor and the vulnerable
Target 1.4: By 2030, ensure that all men and women, in particular the poor and the vulnerable, have equal rights to economic resources, as well as access to basic services, ownership and control over land and other forms of property, inheritance, natural resources, appropriate new technology and financial services, including microfinance
Target 1.5: By 2030, build the resilience of the poor and those in vulnerable situations and reduce their exposure and vulnerability to climaterelated extreme events and other economic, social and environmental shocks and disasters
Target 1.a: Ensure significant mobilisation of resources from a variety of sources, including through enhanced development cooperation, in order to provide adequate and predictable means for developing countries, in particular least developed countries, to implement programmes and policies to end poverty in all its dimensions
Target 1.b: Create sound policy frameworks at the national, regional and international levels, based on pro-poor and gender sensitive development strategies, to support accelerated investment in poverty eradication actions.
I will critically analyse in the following section Target 1.1 and Target 1.a of SDG 1. The most authentic document to know the status of India’s progress towards achieving the SDGs is the Sustainable Development Goals National Indicator Framework Progress Report, 2020 (Version 2.1), which has been produced by the MoSPI. As stated earlier, the MoSPI not only developed the NIF, it also coordinates with the line Ministries for establishing the flow of data for SDG indicators.
In its latest report on SDGs, the MoSPI has considered poverty as a multidimensional concept and stated that poverty “manifests in the form of diminished opportunities for education, hunger & malnutrition, social discrimination and the inability to participate in decision-making processes.” And yet it is found from the same document that that the two indicators chosen for measuring poverty are “1.1.1: Proportion of population living below the national poverty line, 2011-12 (in percentage)” and “1.1.2: Poverty Gap Ratio, 2011- 12 (in percentage).”
Thus, it can be stated that India officially measures income or expenditure poverty and not non-income poverty. In other words, no composite index to measure poverty has been developed officially, which is based on various multidimensional indicators capturing deprivations and denials.
Measuring and Reporting Poverty Officially
The “proportion of population living below the national poverty line” is also called the headcount ratio in economics. The poverty line is a common method used to measure poverty based on income or consumption levels.
A person is considered poor if his or her consumption or income level falls below the minimum level necessary to meet basic needs. This minimum level is referred to as the poverty line. For a family of five, the national level poverty line in terms of consumption expenditure was about Rs. 4,080/- per month in rural areas and Rs. 5,000/- per month in urban areas in 2011- 12. These poverty lines varied from state to state because of inter-state price differentials. The percentage of persons below the poverty line in 2011-12 has been estimated as 25.7 percent in rural areas, 13.7 percent in urban areas and 21.9 percent for the country as a whole (as per the Tendulkar Methodology, which was accepted by the erstwhile Planning Commission). In 2011-12, India had 270 million persons living below the Tendulkar Poverty Line.
Poverty gap ratio helps us to understand the severity of poverty. It is the mean shortfall of the total population from the poverty line (counting the non poor as having zero shortfall), expressed as a percentage of the poverty line. Poverty gap ratio at national poverty lines (%) in India was reported at 5.05 percent in rural areas, 2.70 percent in urban areas and around 4.0 percent at the national level.
Based on the Consumption Expenditure Survey done by the erstwhile National Sample Survey Office (NSSO), income poverty was calculated last time in 2011- 12. Although the periodicity for bringing out the figures related to the two indicators under target 1.1 is five years, the country does not have recent estimates about income poverty.
On the basis of the leaked National Statistical Office (NSO) survey report ‘Key Indicators: Household Consumer Expenditure in India,’ Somesh Jha of Business Standard reported that the real (i.e. adjusted for inflation, keeping 2009-10 as the base year) monthly per capita consumption expenditure fell by -3.7 percent to Rs. 1,446/- in 2017-18 from Rs. 1,501/- in 2011-12. Although monthly per capita consumption spending in rural areas declined by -8.8 percent in 2017-18, it rose by two percent over six years in the urban areas. Falling real per capita consumption expenditure indicated an increase in the prevalence of poverty, said the Business Standard news report.
The data obtained from the 75th round of survey by NSO during the period July 2017 to June 2018 has been deemed unfit officially for constructing the new income poverty line and measuring the latest income or expenditure-based poverty. Because of discrepancies in the data and issues about data quality, the monthly per capita consumer expenditure data pertaining to 2017-18 has not been used by the central government. Although the government has thought about a Consumption Expenditure Survey in 2020-2021 and 2021- 22, collection of household level data based on door-to-door, random sample survey (and not telephonic data) may be difficult due to the ongoing pandemic.
Measuring Multidimensional Poverty
Unlike the income-based or expenditure-based measures of poverty, multidimensional poverty is not necessarily expressed in money-metric terms.
The economic progress made by the countries since the last three decades to reduce poverty would be reversed by the pandemic.
The poverty line method follows a unidimensional approach since it is based on money metric terms (poverty is measured in terms of income or expenditure--a sum of money) as opposed to non-money-metric indicators, such as prevalence of under-nutrition, access to toilets, etc. that captures the multiple dimensions of poverty.
Multidimensional poverty is about its non-monetary aspect and is strongly associated with the challenges of achieving
the SDGs. Although previously defined only in monetary terms, poverty is now understood to include the lived reality of people’s experiences and the multiple deprivations they face.
For long, economists have argued among themselves whether income should be the only criterion for measuring poverty. After all, in real life a person can face multiple deprivations, say, in terms of access to education, health and living standards, among others. The multidimensional poverty index (MPI), which offers a valuable complement to traditional income-based poverty measures, was first introduced in the 2010 Human Development Report (HDR). The MPI looks at both the number of deprived people and the intensity of their deprivations.
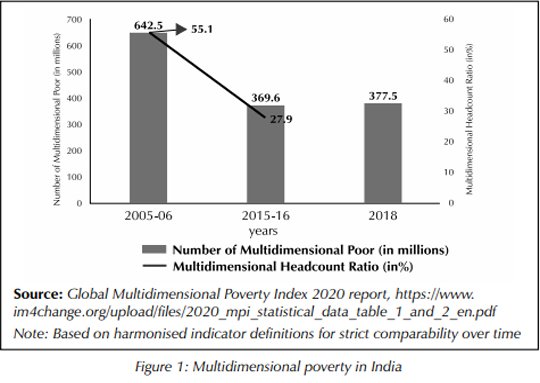
The Global MPI 2020 report, which has been co-produced by the United Nations Development Programme (UNDP) and the Oxford Poverty and Human Development Initiative (OPHI), reveals that the multidimensional headcount ratio (H) i.e. the proportion or incidence of people (within a given population) who experience multiple deprivations has reduced from 55.1 percent to 27.9 percent during the last 10 years i.e. between 2005-06 and 2015-16.
The total number of poor people, who face multiple deprivations in education, health and living standards, has dropped by around 273 million in the last one decade i.e. from 642.5 million to 369.6 million between 2005-06 and 2015-16. However, the same report by UNDP and OPHI has estimated that the total number of multidimensionally poor people in the country has increased by 7.9 million between 2015-16 and 2018.
Released in July 2020, the report by UNDP and OPHI indicates that multidimensional poverty index (MPI) of India, which is the product of multidimensional headcount ratio (H) and intensity (or breadth) of poverty (A), was 0.123 in 2015-16. In comparison to India, MPI values in Bangladesh (0.104) and Sri Lanka (0.011) were lower, whereas MPI values for Afghanistan (0.272), Myanmar (0.176), Nepal (0.148) and Pakistan (0.198) were higher. A lower value of MPI is socially desirable since it shows reduction in multidimensional poverty.
The intensity of poverty (A), which measures deprivations that multidimensionally poor people face on an average, has declined from 51.3 percent to 43.9 percent between 2005-06 and 2015-16.
The MPI-T value (i.e. multidimensional poverty index estimate that is based on harmonised indicator definitions for strict comparability over time) for India has decreased from 0.283 to 0.123 between 2005- 06 and 2015-16.
Please note that MPI is a measure that looks beyond income to include access to safe water, education, electricity, food and six other indicators.
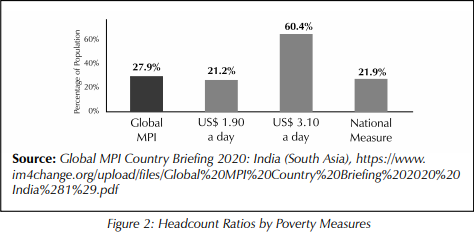
Figure 2 compares the headcount ratios of the MPI and monetary poverty measures. The height of the first bar of figure 2 shows the proportion of people who are MPI poor. The second and third bars represent the percentage of people who are poor according to the
World Bank’s $1.90 a day and $3.10 a day poverty lines. The last bar represents the percentage of people who are poor according to the national income or consumption expenditure poverty measures.
It is clear from figure 2 that a higher proportion of Indians suffer from multidimensional poverty vis-à-vis the monetary poverty that is nationally measured.
Also, note that multidimensional poverty index and related measures are calculated by UNDP and OPHI for 2005-06 and 2015-16 on the basis of data collected during the National Family Health Surveys.
Policies and Programmes for Poverty Reduction
Although economic growth has been slowing down in the recent quarters prior to the lockdown (from Q4 of 2017- 18 to Q2 of 2020-21; see table-2),
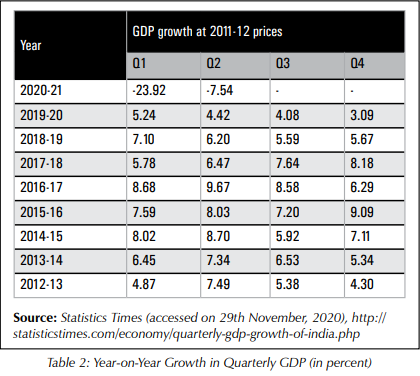
contraction in real Gross Domestic Product (GDP) during the first two quarters of the current fiscal year has led to a decline in the Gross Receipts of the government -- both the central government and the state governments/ UTs. As a result, spending by the central government and the state governments have been severely affected. Latest available data of the Controller General of Accounts under Ministry of Finance shows that the Total Receipts of the Union Government (of which Tax Revenue,
Non-Tax Revenue and Non-Debt Capital Receipts are parts) was Rs. 7.08 lakh crore during April-October 2020-21 against Rs. 9.34 lakh crore in the corresponding period last year. Hence, Total Receipts of the Union Government has dipped year-on-year by -24.2 percent.
The Total Expenditure of the Union Government (of which Revenue Expenditure and Capital Expenditure are parts) was Rs. 16.61 lakh crore during April-October 2020-21 against Rs. 16.55 lakh crore in the corresponding period last year. Hence, Total Expenditure (in nominal terms) of the Union Government has grown year-onyear by just +0.40 percent.
If the retail inflation of +7.61 percent in October, 2020 is taken into account, then one finds that the real expenditure of the Union Government has shrunk year-on-year by -7.21 percent. However, if the wholesale price inflation of +1.48 percent in October, 2020 is considered, then we see that the real expenditure of the Union Government has contracted year-on-year by -1.08 percent.
Target 1.a of the SDG 1 is about ensuring significant mobilisation of resources from a variety of sources to implement programmes and policies to end poverty in all its dimensions. However, the Gross Expenditure of the central government (in real terms i.e. expenditure adjusted against inflation whether retail or wholesale) has been down this fiscal year on account of its low receipts (as we saw above). Due to its commitment to the Fiscal Responsibility & Budget Management (FRBM) Act, the union government has not
A variety of policy instruments can be used by the government to increase its spending, including monetisation of deficit through borrowing from the RBI and spending financed by borrowing from the IMF and the World Bank.
opened its purse to the extent that is required to move the economy out of recession. The government did not agree to the demand for a monthly cash transfer of Rs. 7,000 or so for the poor and the needy, which was suggested by civil society members. In order to help the poor during the Covid-19 lockdown, the government had on March 26, 2020 declared that an ex-gratia monthly payment of Rs. 500 would be given to women Jan Dhan account holders for the next three months, starting from April. Data collected between April 13, 2020 and May 20, 2020 for the Azim Premji University COVID-19 Livelihoods Survey indicates that nearly 33 percent of the Jan Dhan account holders had received the cash transfers, whereas 7 percent of them did not receive the amount, despite having Jan Dhan accounts. Nearly 60 percent of households surveyed did not have these accounts. Incomplete financial inclusion and technical issues (like aadhaar seeding not being done and mismatch in name spellings between bank passbook and aadhaar) have also hampered whatever little benefits the government disbursed to the poor in terms of cash during the lockdown.
Without adequate spending by the government during the pandemic struck year, which is over and above what it spends in a normal year, the purchasing power (measured in terms of wages and remunerations) of not only the self-employed and the casual workers but also the regular and salaried employees has been adversely affected. International Labour Organisation’s flagship Global Wage Report 2020–21, citing a study by Estupinan and Sharma (2020), mentions that formal workers’ wages (at 2017-18 prices) in the organised sector were slashed by -3.66 percent, whereas informal sector workers witnessed a much sharper fall in their wages (at 2017-18 prices) to the tune of -22.62 percent during the period between March 24, 2020 and May 3, 2020. Lack of social protection among the self-employed and the casual workers made them more income-insecure during the period of lockdown in comparison to the formal sector employees.
The recently released GDP estimates show that the share of Private Final Consumption Expenditure (i.e. aggregate consumer spending on final goods and services domestically at constant prices) in the total GDP (at constant prices) has fallen to 54.2 percent in Q2 of 2020-21 (i.e. July-September this year) from 56.5 percent during the corresponding period last year. The value of this share in July-September (i.e. 54.2 percent) was marginally lower than that of the first quarter (54.3 percent) of the current fiscal year.
There has been a year-on-year contraction in the Private Final Consumption Expenditure (at 2011-12 prices i.e. in real terms) by -18.9 percent during AprilSeptember, 2020. Similarly, Government Final Consumption Expenditure (in real terms) has shrunk year-on-year by -3.9 percent during the first half of 2020-21. With both private consumer expenditure and Government expenditure falling in the first half of the current fiscal (in real terms) vis-à-vis the corresponding period last year, private investment may be disappointingly low in the near future. Excess capacity will prevail due to low effective demand in the economy. Thus, overall GDP growth may be affected in the second half of 2020-21 and possibly next year.
Growth in real GDP provides the government with additional revenue to spend. However, with low growth in the foreseeable future, the government may have little money to spend from its empty coffers unless it violates the FRBM Act or amends it. A variety of policy instruments can be used by the government to increase its spending, including monetisation of deficit through borrowing from the Reserve Bank of India (RBI) and spending financed by borrowing from the IMF and the World Bank, which will prevent wasteful expenditure usually associated with spending financed through monetisation of deficit (i.e. printing of notes or money by the RBI). There can also be the reintroduction of inheritance and wealth tax for those with wealth of Rs. 5 crore and above. The tax net can also be cast wider to effectively tap e-commerce, etc.
Target 1.b of the SDG 1 talks about creating sound policy frameworks at the national, regional and international levels, based on pro-poor and gender sensitive development strategies, to support accelerated investment in poverty eradication actions. However, in the absence of adequate financial resources being spent by the government on account of its low revenue collection and its adherence to the FRBM Act, most poverty reduction policies may not be implemented properly and, thus would remain just on paper. Similarly, it will be difficult for the government to implement nationally appropriate social protection systems and measures for all, which comes under Target 1.3 of SDG 1 unless it is committed to spend more.
Dearth of financial resources with the government will make it difficult to not only reduce multidimensional poverty but also achieve the other SDGs such as the ones related to ‘hunger, food security and nutrition’ (Goal-2) and ‘productive employment and decent work’ (Goal-8). Since the SDGs are not legally binding, it is possible that they will remain only on paper in the post-Covid world unless the civil society pushes the government to go for adequate social sector spending.
*Shambhu Ghatak is Senior Associate Fellow at Common Cause
Photographs courtesy: Shambhu Ghatak
( References )
- (1) Global Wage Report 2020–21: Wages and minimum wages in the time of COVID-19, International Labour Organisation, released on 2 December, 2020, https://bit.ly/2KwwYcw
- (2) There’s Nothing to Celebrate About Q2 GDP Estimates -Prabhat Patnaik, 5 December, 2020, https://bit.ly/37M5kkD
- (3) Press Note on Estimates of GDP for the Q2 (July-September) 2020-2021, released on 27th November, 2020, National Statistical Office (NSO), Ministry of Statistics and Programme Implementation (MoSPI), https://bit.ly/38wMugK
- (4) Controller General of Accounts under Ministry of Finance, accessed on 5th December, 2020, https://bit.ly/38v14Fy
- (5) Statistics Times, accessed on 29th November, 2020, https://bit.ly/37NBJqU
- (6) Consumer Price Index Numbers on Base 2012=100 for Rural, Urban and Combined for the month of October, 2020, National Statistical Office (NSO), Ministry of Statistics and Programme Implementation (MoSPI), released on 12th November, 2020, accessed on 4th December, 2020, https://bit.ly/2WLP3Ws
- (7) Index Numbers of Wholesale Price in India for the month of October, 2020, Ministry of Commerce, released on 16th November, 2020, accessed on 4th December, 2020, https://bit.ly/3ow3OZN
- (8) COVID-19 Weekly Epidemiological Update, World Health Organisation, dated 22 December, 2020, https://bit.ly/3rvk8vK
- (9) World Economic Outlook, October 2020: A Long and Difficult Ascent, International Monetary Fund, https://bit.ly/3aCJS3u
- (10) Job and Wage Losses in Informal Sector due to the COVID-19 Lockdown Measures in India -Xavier Estupinan and Mohit Sharma, Social Science Research Network (SSRN), 25 August, 2020, https://bit.ly/3mIc2MJ
- (11) Sustainable Development Goals National Indicator Framework Progress Report, 2020 (Version 2.1), National Statistical Office (NSO), Ministry of Statistics and Programme Implementation (MoSPI), https://bit.ly/3nNan9X
- (12) Oxford Poverty & Human Development Initiative, https://bit.ly/37LC8KE
- (13) Global Multidimensional Poverty Index 2020 -- Charting pathways out of multidimensional poverty: Achieving the SDGs, United Nations Development Programme (UNDP) and Oxford Poverty and Human Development Initiative (OPHI),https://bit.ly/34IJjkN
- (14) Global MPI Country Briefing 2020: India (South Asia), https://bit.ly/3hhzj7g
- (15) Rebuild India’s confidence, revive the economy -Manmohan Singh and Praveen Chakravarthy, The Hindu, 3 August, 2020, https://bit.ly/2WFClss
- (16) Data dashboard of the COVID19: Analysis of Impact and Relief Measures study, Centre for Sustainable Employment, Azim Premji University, accessed on 13th May, 2020, https://bit.ly/2WG8iRx
- (17) It’s time to give IRS officers their due -TCA Ramanujam, The Hindu, 14 May, 2020, https://bit.ly/3hgsnqP
- (18) A plan to revive a broken economy -Harsh Mander, Jayati Ghosh and Prabhat Patnaik, The Hindu, 14 May, 2020, https://bit.ly/2JnMGGA
- (19) Covid-19 crisis calls for universal delivery of food and cash transfers by the state -Jayati Ghosh, Prabhat Patnaik and Harsh Mander, The Indian Express, 27 April, 2020, https://bit.ly/3ruu9JY
- (20) Press release: Finance Minister announces Rs 1.70 Lakh Crore relief package under Pradhan Mantri Garib Kalyan Yojana for the poor to help them fight the battle against Corona Virus, Ministry of Finance, dated 26th March, 2020, Press Information Bureau Delhi, please click here to access,https://bit.ly/34IJRal
- (21) Press release: Household Consumer Expenditure Survey, Ministry of Statistics and Programme Implementation (MoSPI), Press Information Bureau, 15 November, 2019, https://bit.ly/2KSyXYy
- (22) Consumer spend sees first fall in 4 decades on weak rural demand: NSO data -Somesh Jha, Business Standard, 14 November, 2019, https://bit.ly/34YuOtx
- (23) The SDG India Index -- Can bold global ambition be translated into effective ground reality? -Mitu Sengupta, Orfonline.org, 15 January, 2019, https://bit.ly/3nTldeY
- (24) Press release: World leaders adopt Sustainable Development Goals, UNDP, September 25, 2015, https://bit.ly/37Jkuar
- (25) A new sustainable development agenda, UNDP, https://bit.ly/3mV3UZH
- (26) Press Note on Poverty Estimates, 2011- 12, Planning Commission, July 2013, https://bit.ly/2WJdhB2
- (27) India - Poverty Gap At National Poverty Line, https://bit.ly/3rsst3h
- (29) Indicators for monitoring the MDGs, https://bit.ly/2M0inq9
- (30) Deficit Measurement in India, https://bit.ly/3rr2w4f
NEXT »


