
Running From Pillar to Post
Running From Pillar to Post
Travails of Cybercrime Redressal System
As India’s digital economy expands, cybercrime is a growing threat that exposes individuals to financial losses, data theft, hacking, online harassment, and more. Yet, its impact extends beyond the immediate harm caused by the offence itself. What happens after the crime? A crime where the perpetrator is faceless, the loss is shapeless, but the impact is felt in all realness.
To answer this question, the Status of Policing in India Report 2026 goes all across India, and asks 8,306 citizens in 16 states about how they use the internet, if they have been victimised by it, and where and how they sought justice. This article delves into the findings from Chapter 5 of the report, which examines how victims navigate the redressal system, specifically the police and courts.
The Police Station Run
For most victims, the first instinct was to go to the police. Over half (51 per cent) complained to the police, and another 11 per cent said they initially went to the police, but did not pursue their case further. That leaves about a third (34 per cent) who did not complain at all. When asked why, nearly three in ten (28 per cent) said that they did not lose a big enough amount to complain, one in seven (14 per cent) found the complaint procedure difficult or complex, and one in ten were afraid of going to the police.
Complaints did not all begin at the same place. Half of those who complained (50 per cent) went to their local police station, while about a fifth (18 per cent) went to the cyber cell near them. The rest either called the local/cyber police station (10 per cent), cybercrime helpline (9 per cent), filed an online complaint (5 per cent), or complained to the bank (5 per cent). Those who walked into a police station then met the waiting room. About three in ten (30 per cent) waited for less than an hour, but the largest group (45 per cent) waited for about 2-3 hours. One in ten waited for 4-5 hours, and three per cent waited for more than five hours. It was also found that the most economically disadvantaged were three times less likely than the rich to wait for less than an hour. However, it must be noted that 46 per cent of the poor who visited the police station, did not report their waiting times.
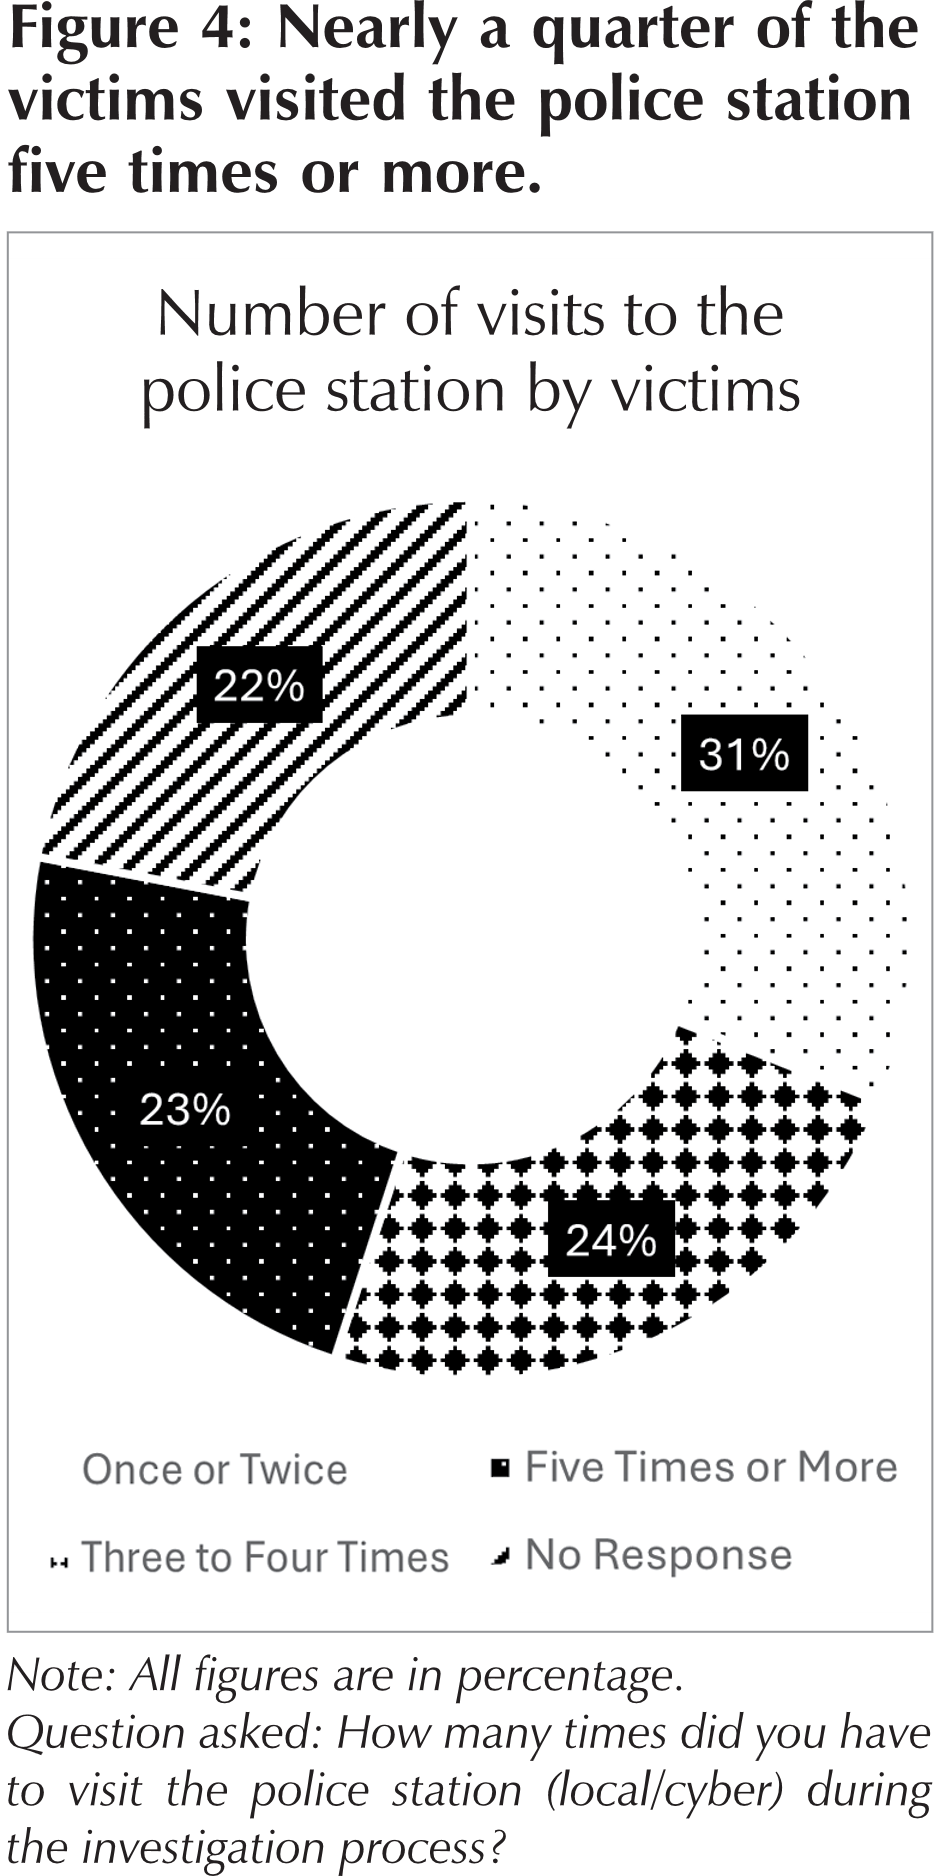
As for the number of times people had to visit the police station, about a quarter (23 per cent) made five or more visits (Figure 4), while two in five (41 per cent) people who assisted victims did the same. This points towards an enormous amount of leg work required of victims to seek justice. Rural victims were twice as likely (38 per cent) to visit the police station five or more times than urban victims (19 per cent).
Was it Worth the Trip?
Given all those visits, how did victims rate the experience? About a fifth (17 per cent) found it “very difficult” to get their complaint registered, while a quarter (25 per cent) found it “somewhat difficult”. Economically weaker respondents were more likely to find the complaint registration process easy compared to their richer counterparts. Two in three (66 per cent) poor respondents found it easy to register their complaint, while over half of the rich respondents (55 per cent) reported the same. Across genders, women were more likely to rate the process easier than men (61 per cent and 54 per cent, respectively).
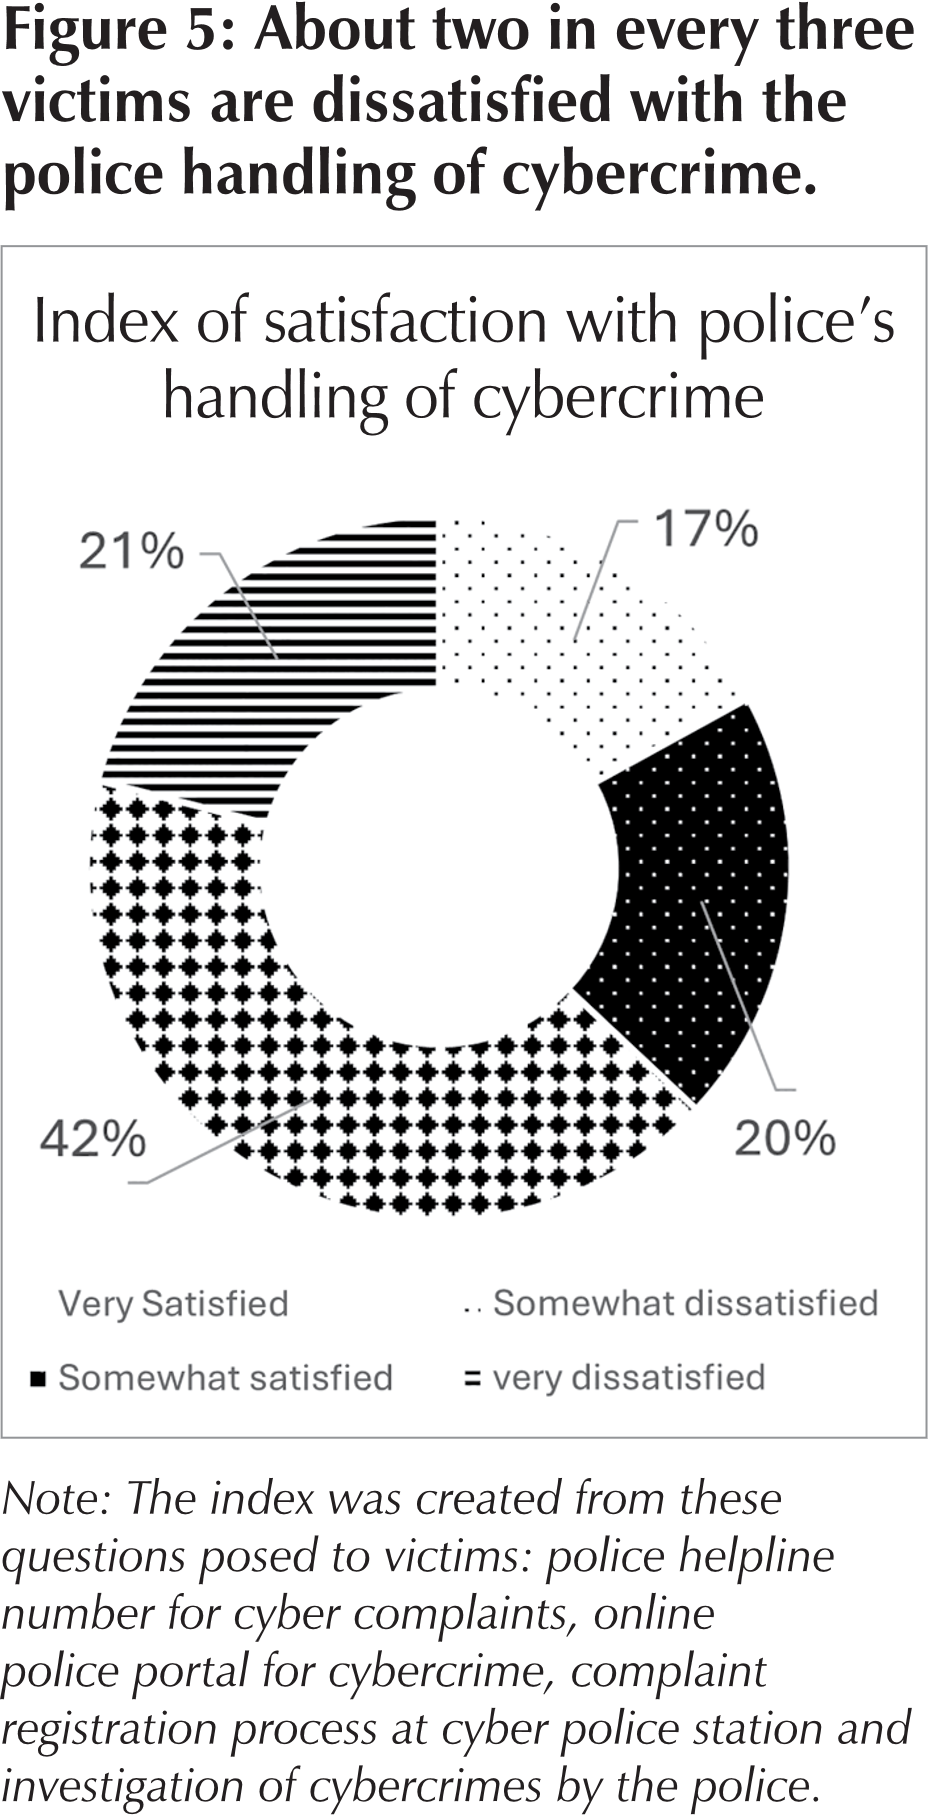
However, an easy start was not the same as an easy road to justice. To judge the whole journey, from registering the complaint to the resolution of the case, a composite satisfaction index was created (Figure 5). It was found that about two in every three (63 per cent) victims were dissatisfied with the police’s handling of their cybercrime. Two in five (42 per cent) victims were “somewhat dissatisfied”, and a fifth (21 per cent) were “very dissatisfied”. When seen across different social demographics, women, rural, and the most economically disadvantaged victims were the most likely to be dissatisfied with the police’s handling of their case.
Greasing the Machine
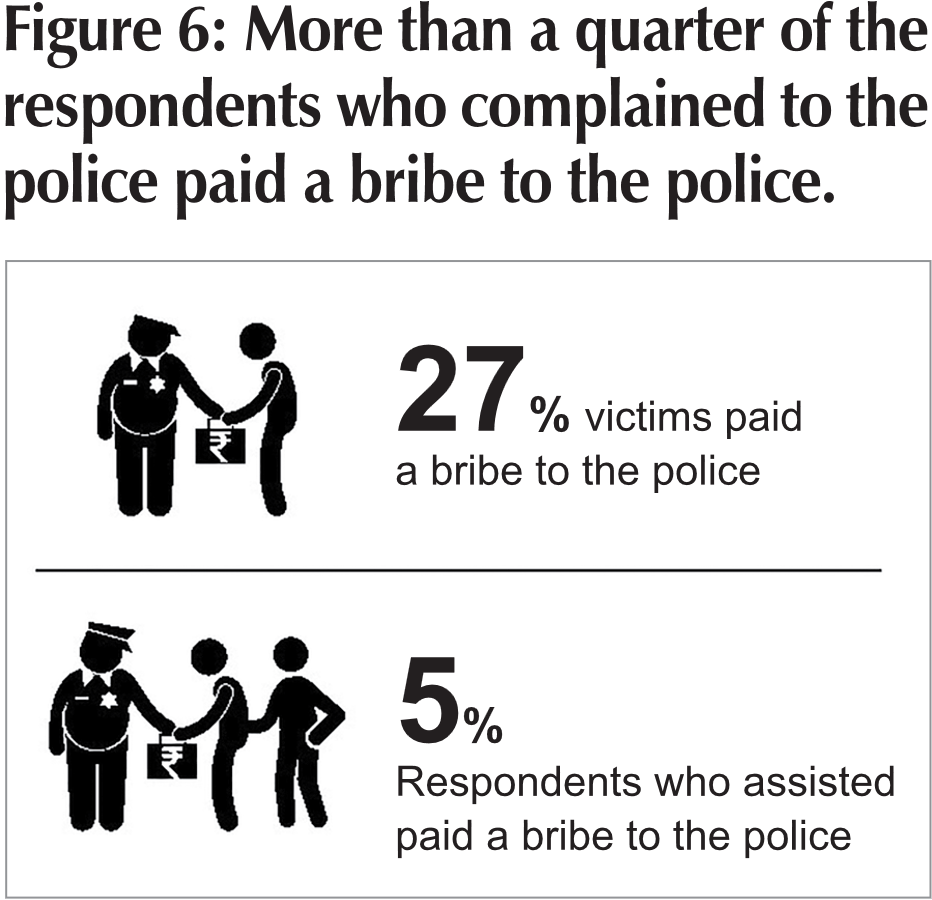
A striking proportion – over a quarter of victims (27 per cent) – reported paying a bribe to the police (Figure 6). Women were more likely to pay a bribe than men, with over one in three (35 per cent) women paying a bribe, compared to over one in five (22 per cent) men. But class made the starkest difference. Among those who paid a bribe to the police, over half (51 per cent) were the most economically disadvantaged, compared with 18 per cent of lower class, 17 per cent of middle class, and 12 per cent of rich victims.
For someone at the bottom of the economic ladder, any amount lost is significant, and getting it back is worth paying for. It is a sign of how exposed they are – easily exploited by the very people they turn to for help, and carrying the double burden of financial loss.
When seen across localities, one in three (36 per cent) rural victims paid a bribe to the police, compared to one in four (24 per cent) urban victims. Respondents were very hesitant to reveal the amount that they paid as a bribe, with about two in three (65 per cent) victims not disclosing the amount.
Following the thread of bribery to its logical end, the question whether recovery of lost money was possible or not, needs to be examined. Those who paid a bribe were three times (38 per cent) more likely to recover the full amount, compared to those who did not pay a bribe (12 per cent). An additional 16 per cent who paid a bribe achieved partial recovery, compared to 10 per cent partially recovering their money without a bribe. An overwhelming majority, three in four (75 per cent) victims who did not pay a bribe recovered none of their money, compared to about two in five (38 per cent) victims who paid a bribe. The difference is clear; you have got to spend money to find your lost money.
Bribes were not the only facilitators. More than a third of the victims (37 per cent) reached out to their personal network to nudge the police into investigating, and the majority (47 per cent) went straight to senior police officers. Women, victims from rural areas, and the most economically disadvantaged were more likely to leverage their personal network than their counterparts. Two in five women (41 per cent) had contacted someone in their personal network compared to a one in three (35 per cent) men. Almost the same proportion goes for rural victims (44 per cent vs 35 per cent). Across economic classes, 55 per cent of the poor respondents reached out to someone, compared to 30 per cent of the rich respondents.
Connections paid off. Over a quarter (28 per cent) of those who leveraged their personal connections fully recovered their money, and less than a fifth (17 per cent) achieved a partial recovery, and a little less than half (48 per cent) recovered none of their money even with personal connections (Figure 7).
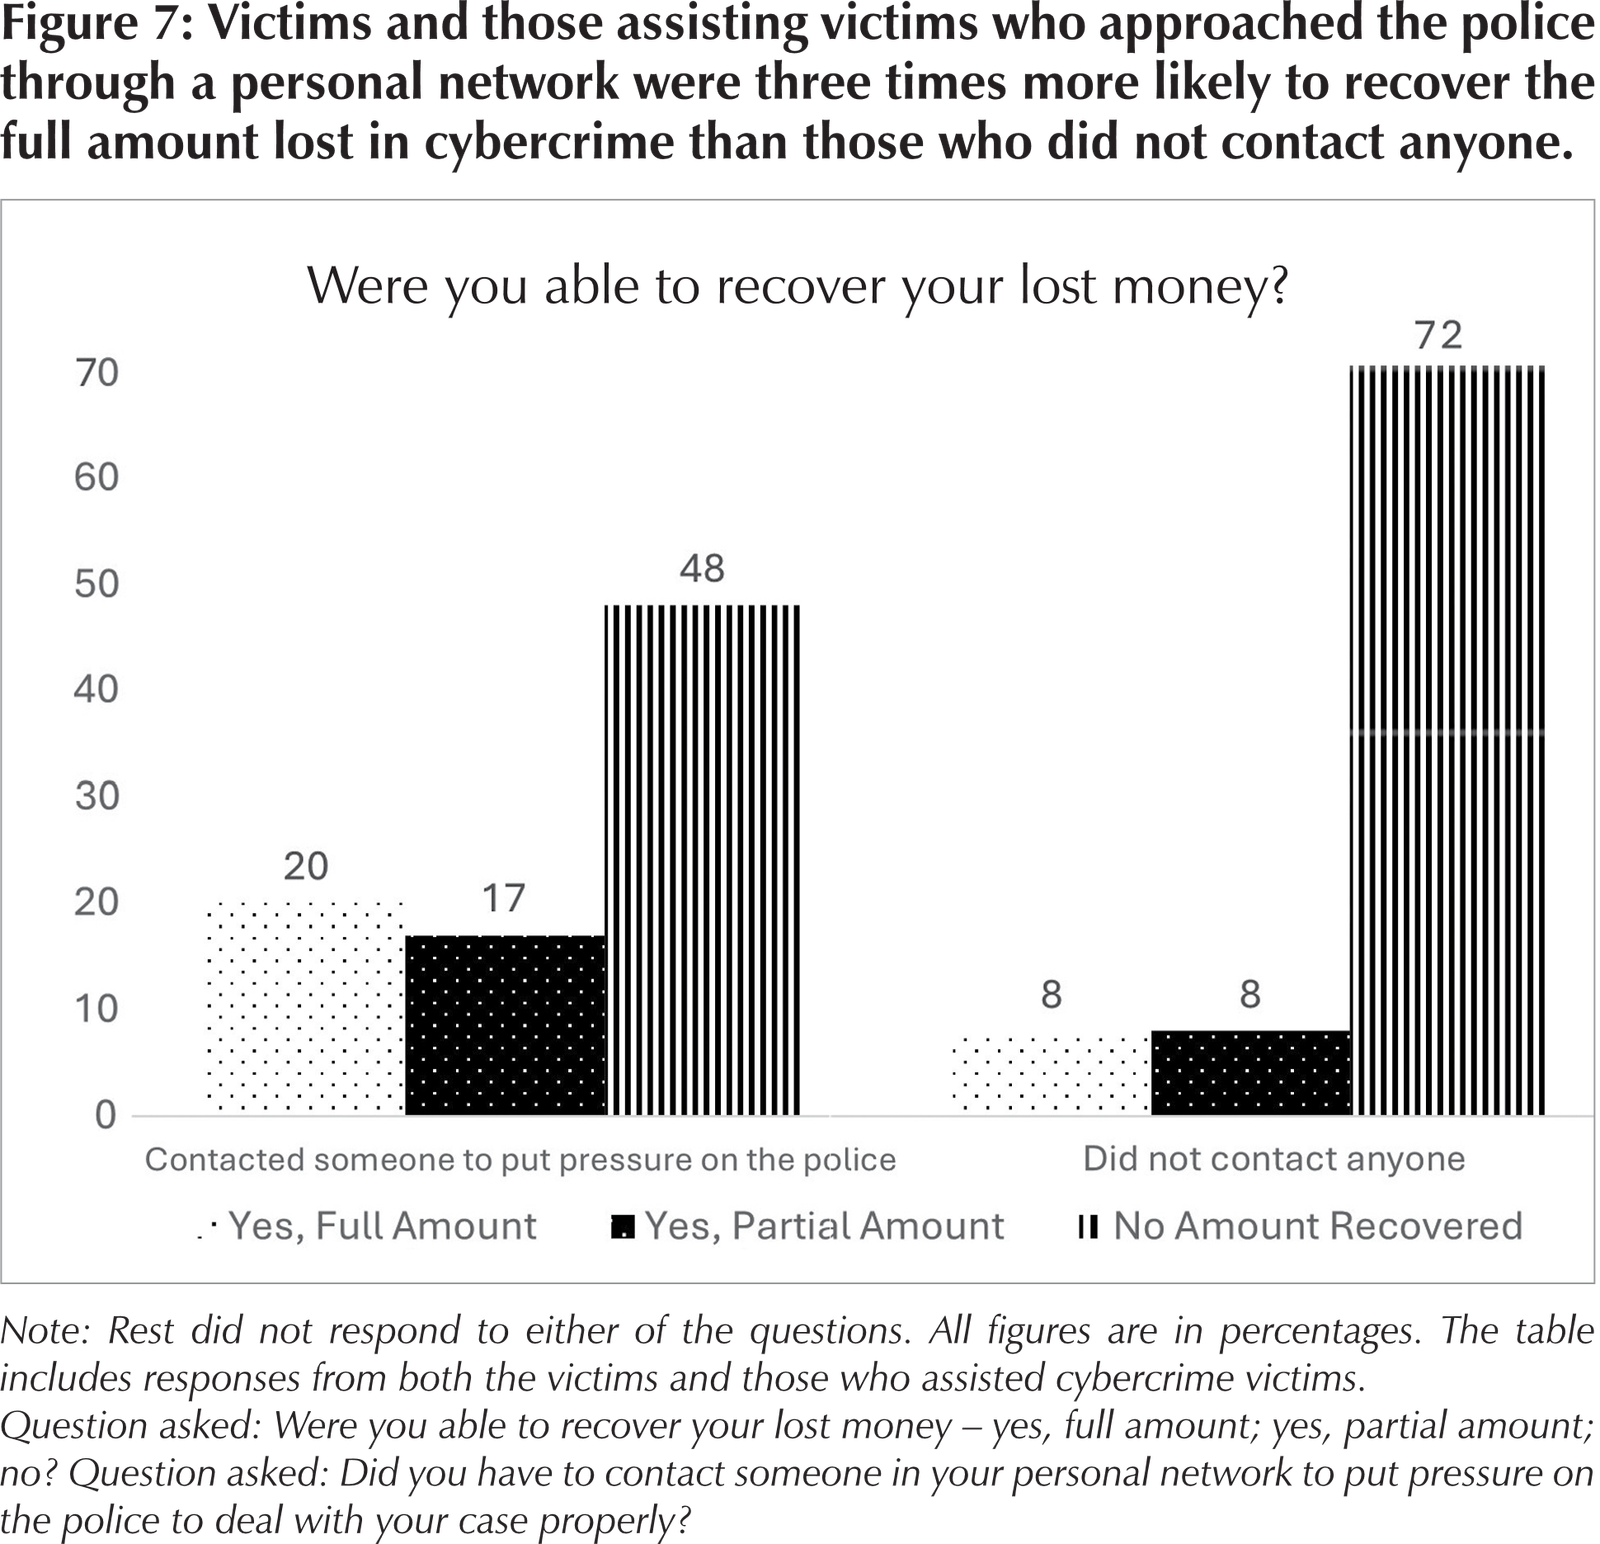
The difference is although very stark when recovery is measured without any personal connections. Less than one in ten (8 per cent) were able to recovery the full amount without any personal connection, and the same proportion recovered a partial amount. Almost 72 per cent of those without any personal network, did not recover any money.
The message is clear: you need to oil the justice machine to get it working. You either grease the palms of the officers or have inroads with people in a position of influence over the police who can shift the gears in your favour.
Courts: The Last Piece of the Redressal Puzzle
One in five victims (20 per cent) had their cases progress to courts. Courts typically function as the last resort for victims, where a court order is necessary to get the lost funds transferred between banks, or in the words of bankers, get them “released” from the bank account they are “held” or “frozen”. Courts also serve as a decisive step in the redressal process where the banks and victims can get tangible actions since the banks — as evidenced by interviews in the report — typically shrug off responsibility, derelict remedial actions for the fraud, or shift the blame onto the customer for being defrauded/ ‘cooperating with the fraudster’.
The victims whose cases went to court were mostly satisfied with the outcome, with 42 per cent being “completely satisfied”, 26 per cent being “somewhat satisfied”. However, 22 per cent did express complete dissatisfaction with the outcome of their case in court.
The Map to Justice is Bought
The pillars are all standing. India has police stations, cyber cells, helplines, banks and courts. The trouble is it is the victim who queues for hours, returns five times, asks a well-placed acquaintance to make the call, or slips money across a desk, all to recover what was theirs to begin with.
Our findings suggest the system, in practice, can reward the wrong things. Money and contacts seem to decide who gets their money back, and the people who are most vulnerable – women, rural residents and the poor – are often the ones paying the highest price to use it. The one pillar that appears to bear weight is the court, but only one in five victims ever reaches it, and even there not everyone goes home satisfied. A justice system should be one people can lean on, not something they have to prop up. Too many cybercrime victims hold up the pillar with their time, money and contacts, and still wonder where the post is. Until the first door a victim knocks on opens as readily as the last, or it is the only door they have to knock, being sent from pillar to post will remain the price of asking for justice.
July September 2026